Nodegoat Workshop
Building a data model with Pim and Geert of LAB1100
One of the aims of the Metromod project is to create a database that will work as an archive as well as a basis for visualisations. We hope that through visualising the trajectories and activities of the exiled artists that we will be able to see connections between the six cities. In addition, by mapping the homes, studios, exhibition spaces, institutions, art objects, meeting places, and organisations linked to the artists we aim to build theories about the cities. Are there clusters of residences or work places? What neighbourhoods are particularly important?
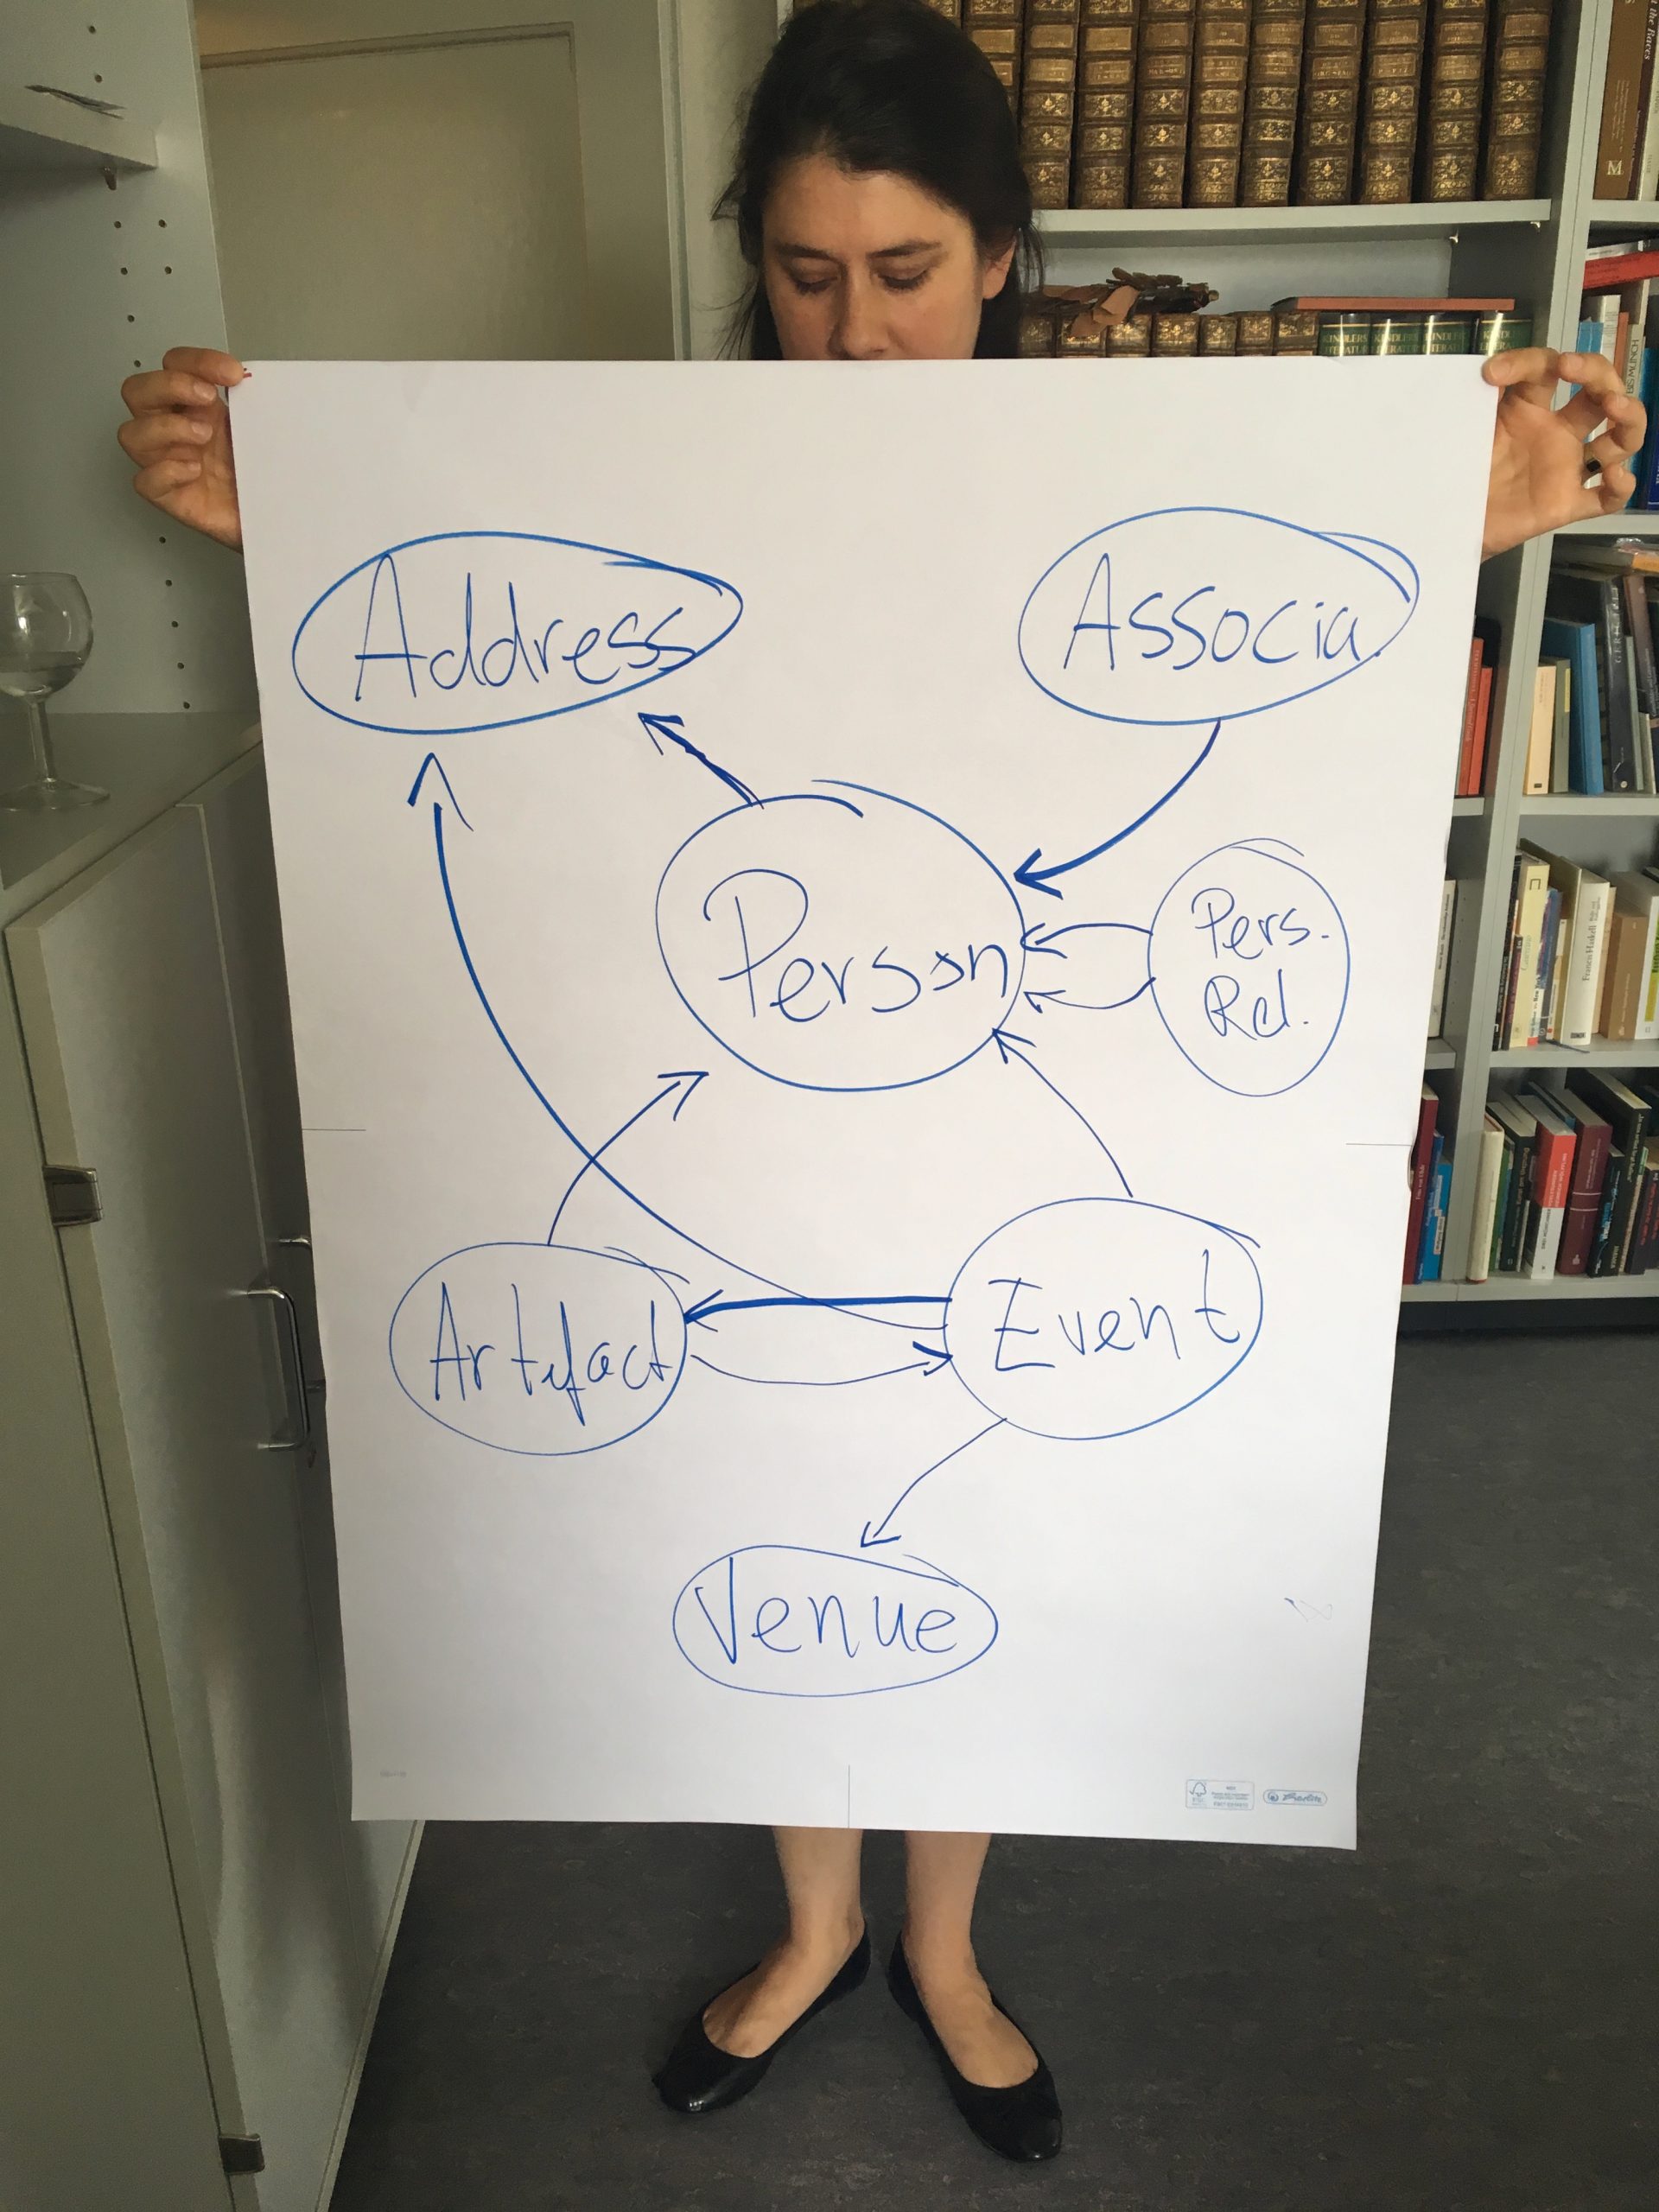
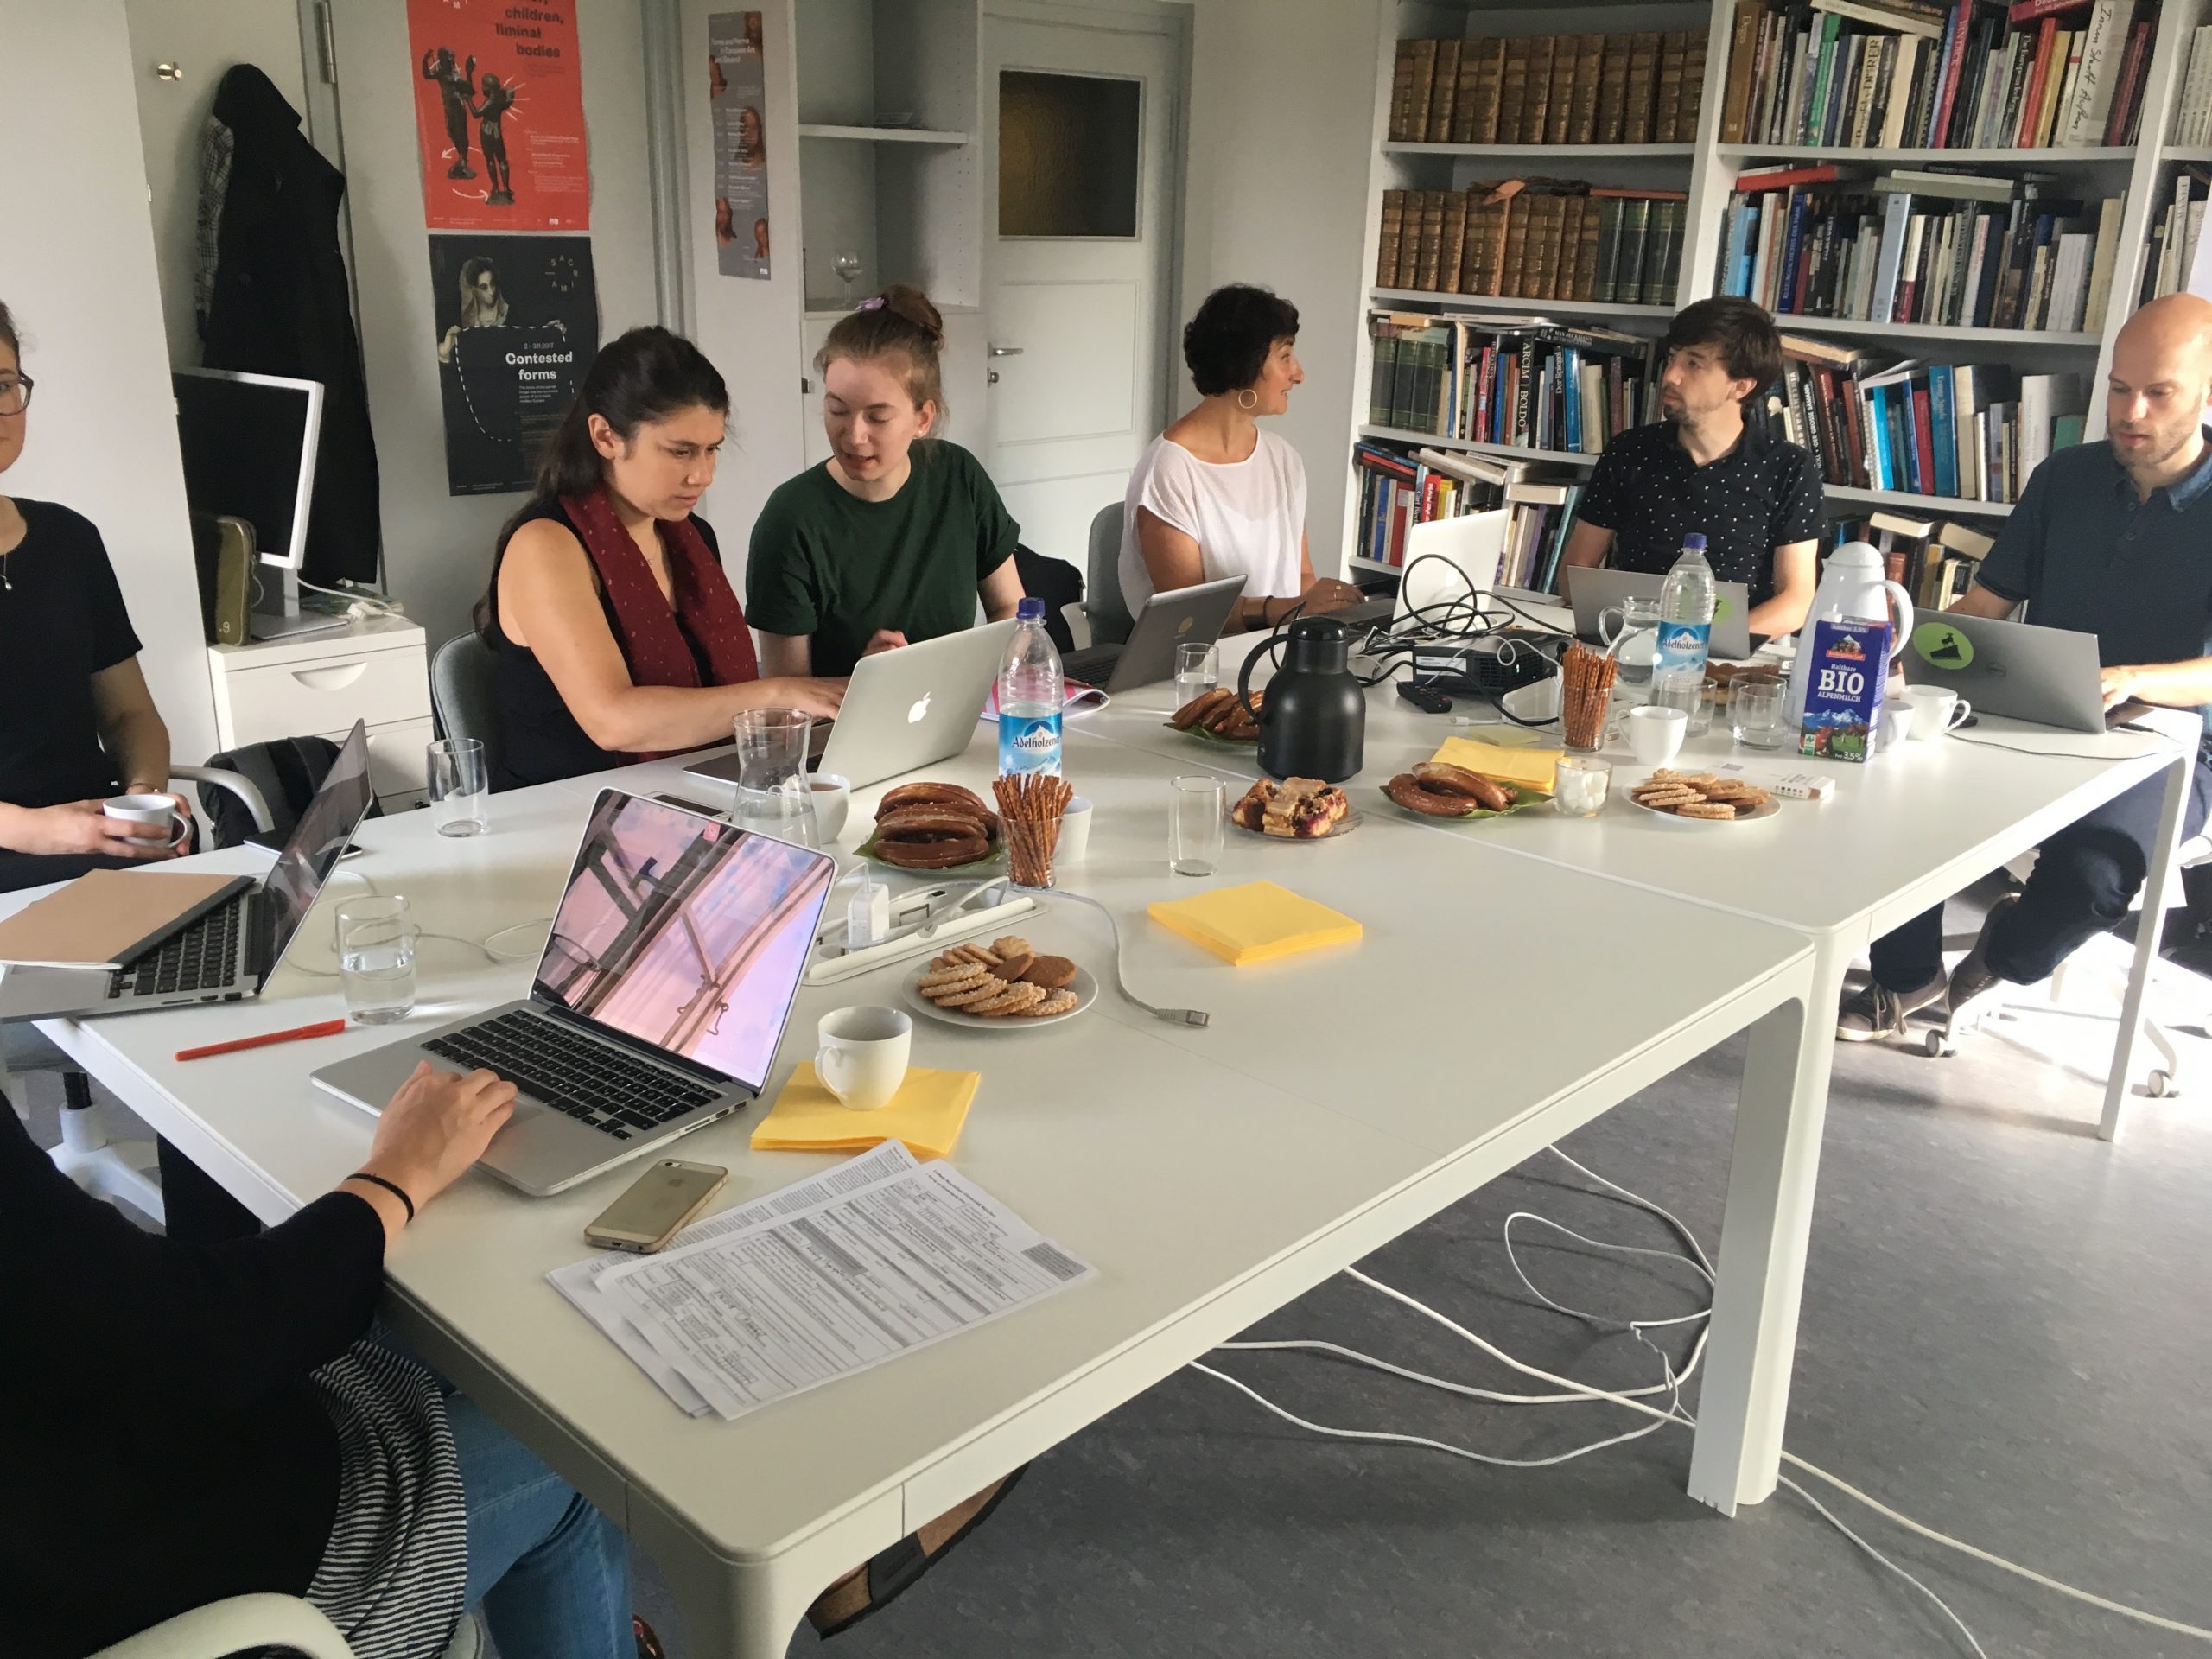
This workshop was dedicated to learning how to use Nodegoat. Through a variety of online input exercises Pim van Bree and Geert Kessels took us through the basics of the data model they had developed. After a few initial mishaps, we were able to input data on persons, artefacts, events, venues, personal relations, associations, addresses, cities and publications, and immediately view the resulting visualisations on the map/timeline embedded within the software. The instantaneous visualisation was particularly gratifying. As well as inputing data we discussed and refined the various categories, and learned how to modify and add to them ourselves.
The workshop confirmed the importance of the data visualisation working package as a research tool, helped build our confidence in working towards that goal, and was thoroughly enjoyable. Pim and Geert have a real understanding of the needs of humanities researchers who are engaging with digital tools and methods.
For more about their work, please visit their website.